

A bench set does not end at the same physiological point for every athlete simply because the program says “eight reps.” Repetition capacity varies, and a fixed count can leave one lifter far from failure while another grinds. Velocity-loss thresholds offer a more observable rule: establish the fastest valid repetition in the set, then stop when concentric velocity has fallen by a chosen percentage. A 25% threshold, for example, ends the set when velocity is 75% of its reference value.
That rule is useful because velocity decline tracks fatigue and the proportion of available repetitions completed, but it is not a direct meter of hypertrophy, motor-unit recruitment or recovery. Bench trials show a recognizable dose response. Low thresholds achieve strength gains with fewer repetitions; moderate loss often gives the largest strength response; high loss accumulates substantially more work and can favor muscle cross-sectional area or repetition endurance. The exact result depends on relative intensity. The largest bench trial to date found that 70–85% 1RM produced the strongest overall adaptations, 25% velocity loss the largest 1RM gain, and 50% loss the largest hypertrophy and endurance gains. Those are group averages, not permission to ignore technique or individual response.
A threshold is a dose decision
- Define the reference rep. Use the fastest valid repetition under a standardized technique; a noisy or misgrooved rep corrupts the threshold.
- Low loss is efficient. Stopping at roughly 0–15% can build strength with far fewer repetitions and less fatigue.
- Moderate loss often favors strength. Bench trials repeatedly place about 25% near the top of the group-average strength response.
- High loss changes the outcome and the cost. Around 50% permits much more volume and may favor hypertrophy or repetition endurance, without consistently adding 1RM.
- Intensity and loss interact. A 25% loss set at 45% 1RM is not the same training task as 25% at 80% 1RM.
Velocity loss (%) = (fastest rep − current rep) ÷ fastest rep × 100State whether the reference is the fastest repetition, first repetition or another anchor. The threshold changes meaning when the denominator changes.
What velocity loss measures
The usual calculation is: 100 × (reference velocity − current velocity) ÷ reference velocity. If the fastest valid rep is 0.50 m/s and a later rep is 0.375 m/s, the loss is 25%. Some systems reference the first repetition; others use the fastest rep reached after the athlete settles into the set. The choice must be consistent because an unusually slow first rep or an unusually fast rebound changes the stop point.
WORKED EXAMPLE · HYPOTHETICAL VALUES
The same reference makes the loss interpretable
Read the change within one set. Keep the velocity metric and the reference rule consistent.
Velocity through the example set
Mean concentric velocity · m/s · zero baseline(0.60 − 0.45) ÷ 0.60 × 100 = 25%. The final repetition retains 75% of the reference velocity.
Sánchez-Medina and González-Badillo showed that within-set velocity loss is strongly related to acute neuromuscular fatigue across resistance exercises [1]. Later bench and squat work found strong relationships between relative velocity loss and the percentage of repetitions completed, but the number of repetitions possible at a given load varied considerably among individuals [2][3]. Velocity loss improves effort standardization; it does not make athletes identical.
Mean concentric velocity describes a repetition. Velocity loss describes decline within a set. Velocity reserve, repetitions in reserve, RPE and failure are related effort concepts with different measurement error. A higher mean velocity in one condition does not prove a smaller velocity loss unless rep-by-rep change was analyzed.
How fast did this repetition move?
Measured in m/s.
How much did speed fall relative to the reference?
Expressed as a percentage.
What changed across a training block?
Requires a repeated outcome test.
FORCE–VELOCITY CONTEXT · BENCH-PRESS APPLICATION
Load, speed & fatigue
Changing the load and slowing down within a set answer two different questions.
01 · ACROSS LOADS
02 · WITHIN A SET
Same external load.
A changing repetition speed.
Velocity loss compares a later repetition with a defined reference. It describes the speed decline while the external load stays the same.
Across-load comparisons require maximal concentric intent and consistent technique. Relative load (%1RM) and force (N) are different quantities. [16][18]
There is no single loading zone that describes every power result. In one bench-press study, the load associated with maximum peak power was 37% 1RM; for maximum mean power it was 56% 1RM. Those are study-specific findings, not universal training boundaries. [17]
The bench-specific dose–response evidence
The four-threshold 2020 trial
Pareja-Blanco and colleagues randomized 64 resistance-trained young men to 0%, 15%, 25% or 50% velocity-loss thresholds in an eight-week bench program. The investigators assessed dynamic and isometric performance, a progressive-loading test, fatigue resistance, pectoralis major cross-sectional area and surface EMG. Load progression and velocity feedback standardized the sessions; allowed loss determined how many repetitions each group completed [4].
All four groups improved dynamic strength, with no significant group-by-time interaction for those strength measures despite large volume differences. Pectoralis cross-sectional area did differ by group: the 50% condition increased more than 0%. Only the 15% group significantly increased peak pectoralis RMS EMG, the 0% group showed an early rate-of-force-development change, and 25% and 50% favored later RFD measures. This was not a linear “more fatigue, more strength” result. High loss maximized muscle size in this protocol, while lower loss produced strength efficiently and distinct neuromuscular changes.
Two intensity-specific extensions
Rodiles-Guerrero and colleagues assigned 50 trained men to the same four thresholds for eight weeks at 55–70% 1RM. All groups except 0% significantly improved 1RM; the 25% condition produced the largest 1RM and load–velocity changes. Only 25% significantly increased pectoralis EMG, while only 50% significantly increased cross-sectional area. The authors favored about 25% for broad adaptation at those moderate loads [5].
With lighter 40–55% loads, a later trial randomized 46 trained men and held frequency, three sets and four-minute rests constant. There was no significant group-by-time strength interaction, though effect sizes again formed an inverted U with 25% generally largest. The total repetition cost was stark: 48 at 0%, 357 at 15%, 547 at 25% and 876 at 50%. The 50% group showed no statistically resolved extra strength gain despite doing more than 18 times the repetitions of 0% [6]. “Efficient” depends on the outcome; for 1RM, the high-loss work was not rewarded.
MEASURED STUDY DATA · 2024 · 46 TRAINED MEN
With light loads, repetition cost rises steeply
Total training repetitions
Published abstract values · 40–55% 1RM · zero baselineEight weeks · 16 sessions · three sets per session. This is a separate report; its values should not be pooled with the 2026 bars.
The 2026 intensity-by-threshold trial
Pareja-Blanco and colleagues randomized 158 resistance-trained men into 12 groups: three intensity bands (40–55%, 55–70% or 70–85% 1RM) crossed with four thresholds (0%, 15%, 25% or 50%). Training lasted eight weeks, twice weekly, with three sets, four-minute rests, a Smith-machine bench, approximately one second on the chest and maximal intended concentric velocity. Individual load–velocity relationships set training loads, and immediate feedback reinforced intent [7].
This combined analysis draws on a broader research project with previously published components; it should not be counted as a wholly independent replication of those reports. There was no three-way intensity-by-loss-by-time interaction, so no single cell can be crowned an absolute winner. Across thresholds, 70–85% produced the greatest strength gains. Pectoralis cross-sectional area was measured only in the 55–70% and 70–85% bands, with the greater increase at 70–85%. Across intensities, the raw mean 1RM changes were 5.9 kg at 0%, 8.2 kg at 15%, 11.2 kg at 25% and 9.2 kg at 50%; the velocity-loss-by-time interaction was significant, and 25% outperformed 0%. Cross-sectional area rose most at 50%, which exceeded 0% and 15%, and 50% produced the greatest maximal number of repetitions.
The volume gradient again mattered. Average training repetitions were about 48 at 0%, 220 at 15%, 336 at 25% and 534 at 50%. A 50% threshold was effective for size and endurance, but 25% produced the largest 1RM gain with roughly 198 fewer repetitions. Statistical significance establishes a group difference under this protocol; the raw kilogram changes communicate its practical magnitude. Baseline 1RM differed slightly across groups, so the bars below are descriptive mean changes, not adjusted causal effects.
MEASURED STUDY DATA · 2026 · 158 TRAINED MEN · 8 WEEKS
Strength gain and repetition cost belong together
Four velocity-loss thresholds, pooled across the tested intensity bands. Each panel has its own units and scale.
Mean 1RM change
kg · post minus pre · zero baselineTraining repetitions
Mean repetitions over the program · zero baselineVL25 versus VL0: the raw mean gain differed by 5.3 kg. VL25 versus VL50: VL25 used 198.0 fewer mean repetitions; the chart does not establish a significant strength advantage over VL50.
Exact plotted values
| Threshold | n | Pre 1RM (kg) | Post 1RM (kg) | Change (kg) | Repetitions (mean ± SD) |
|---|---|---|---|---|---|
| VL0 | 37 | 68.0 | 73.9 | 5.9 | 48.0 ± 0.0 |
| VL15 | 42 | 68.3 | 76.5 | 8.2 | 219.6 ± 144.6 |
| VL25 | 39 | 69.5 | 80.7 | 11.2 | 336.3 ± 197.7 |
| VL50 | 40 | 70.3 | 79.5 | 9.2 | 534.3 ± 259.4 |
MEASURED STUDY DATA · SAME 2026 RESEARCH PROJECT
A different outcome changes the interpretation
Pectoralis size change
Cross-sectional area · cm² · zero baselineRepetition-test change
Maximum repetitions · post minus pre · zero baselineDifferent analysis populations: pectoralis size was assessed only in the 55–70% and 70–85% 1RM bands. The 40–55% band did not undergo that measurement.
Exact plotted values
| Threshold | CSA pre → post (cm²) | Repetition test pre → post |
|---|---|---|
| VL0 | 23.1 → 24.5 | 12.0 → 15.4 |
| VL15 | 23.4 → 25.3 | 11.9 → 16.5 |
| VL25 | 24.5 → 27.4 | 11.3 → 16.6 |
| VL50 | 26.0 → 29.7 | 11.9 → 17.5 |
Read threshold and intensity together
This is a decision map synthesized from bench-specific trials, not a universal prescription or direct reproduction of one study. Threshold effects depend on intensity, device, exercise, athlete and program duration.
Statistical signal versus coaching meaning
A non-significant group interaction does not prove protocols are identical; it means the study did not resolve a difference beyond its uncertainty. Conversely, a significant interaction does not make 25% optimal for every athlete or goal. The 2026 trial’s 5.3 kg raw gap between 25% and 0% is practically visible, but it was achieved with about seven times the repetitions. A time-limited in-season athlete may prefer the smaller gain per block with lower fatigue; a hypertrophy block may accept the higher volume.
Technique can also end the set before the numeric threshold. Duffey and Challis documented systematic bench kinematic changes as fatigue accumulated, including altered bar path and joint coordination [8]. If touch point, pause, range, contact points or bar path leave the prescribed corridor, the repetition is no longer the task used to establish the reference velocity. A velocity device should never overrule a clearly invalid rep.
Anatomy context · Interpreting speed
Two timescales of slowing
A slower part of one repetition and a slower repetition later in a set are different observations.
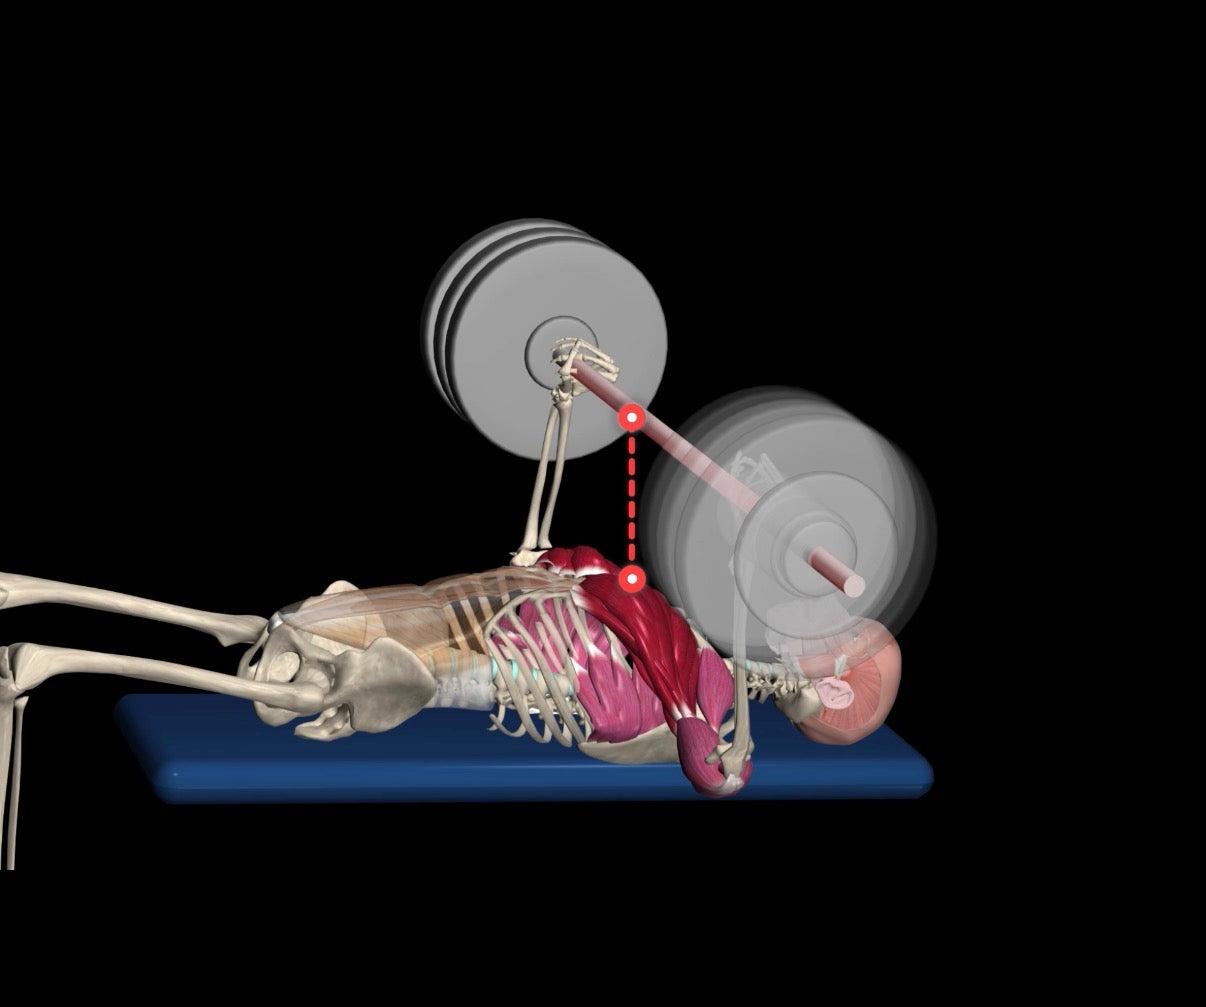
WITHIN ONE REPETITION
The sticking region
Bar speed can fall during part of the upward press. A velocity trace identifies the deceleration region.
ACROSS REPETITIONS
Set-level velocity loss
Compare the same repetition-level velocity measure with a defined reference. A single difficult position does not supply that percentage.
Failure is not required for strength or hypertrophy in every context. A meta-analysis comparing failure and non-failure training found no general advantage for momentary failure when volume was not otherwise controlled, with substantial protocol heterogeneity [9]. Velocity loss is useful precisely because it offers several stopping points before failure rather than reducing every set to “easy” or “all out.”
Efficiency has to be named, not assumed
A low-loss prescription is clearly efficient if the denominator is repetitions or minutes spent accumulating fatigue. It may be less efficient if an athlete needs more sets, more weekly exposures or a longer block to reach a hypertrophy target. Conversely, 50% loss generated the largest pectoralis cross-sectional-area and repetition-endurance responses in the largest trial, but it also required roughly 534 training repetitions versus 48 at 0%. Calling either strategy “best” without naming the outcome hides the tradeoff exposed by the data [7].
Strength efficiency should also be separated from maximum observed strength gain. In the 2026 study, 25% produced the largest raw mean 1RM change and used fewer repetitions than 50%, but 0% still improved strength with a fraction of the work. The practical ratio changes again when session setup, athlete monitoring and equipment time are considered. A team coach may accept slightly less average gain to preserve time and readiness across a roster; an off-season lifter may accept moderate fatigue for the larger group-average response. Neither decision contradicts the trial.
Finally, the programmed percentage is not the received dose unless the reference repetition is valid. If a slow first rep from a poor handoff is used as the reference, the resulting cutoff is lower and can delay stopping. If a bounce produces an artificial fastest rep, the cutoff is higher and can end the set prematurely. Record the fastest valid rep, repetitions completed, terminal velocity, reason for stopping and next-session performance. Those fields distinguish a threshold that managed fatigue from one that merely reacted to measurement noise.
Three 2026 extensions of the threshold evidence
Trained women: outcomes separated by threshold
In 49 trained women completing eight weeks at 70%–85% 1RM, VL50 improved 1RM more than VL0 and was the only condition with a significant within-group increase in measured triceps thickness; the thickness group-by-time interaction was not significant; VL25, not VL50, produced some favorable force–time and EMG changes [10]. The trial is valuable because it broadens a literature dominated by men and shows why “best threshold” depends on the target outcome.
MEASURED STUDY DATA · TRAINED WOMEN · 8 WEEKS
The women’s trial adds an outcome-specific result
Mean 1RM change
kg · post minus pre · 70–85% 1RM · zero baselineExact plotted values
| Threshold | n | Pre 1RM (mean ± SD, kg) | Post 1RM (mean ± SD, kg) | Change (kg) |
|---|---|---|---|---|
| VL0 | 17 | 32.8 ± 7.4 | 35.8 ± 7.7 | 3.0 |
| VL25 | 18 | 32.5 ± 7.9 | 36.1 ± 7.8 | 3.6 |
| VL50 | 14 | 33.5 ± 8.7 | 40.6 ± 7.7 | 7.1 |
Prior fatigue weakens the repetition–loss relationship
In 14 men, Rodiles-Guerrero and colleagues tested a set to failure at 60% 1RM after prior sets stopped at 0%, 20%, 40% or 60% velocity loss. Velocity loss remained useful, but its relationship with repetitions remaining degraded as prior fatigue increased; reliability was better under low-to-moderate fatigue [11]. A threshold cannot erase what happened earlier in the session.
Variable resistance can preserve the signal
Ocaña-García and colleagues reported strong relationships between repetitions completed and velocity loss during band-resisted bench pressing in 26 participants (reported R2 .910–.935) [12]. That supports measurement feasibility under the tested band setup, not automatic interchangeability with straight-weight thresholds.
Measurement quality before threshold precision
Linear position transducers generally provide the most direct bar-displacement measurement, while camera systems, inertial units and cable devices estimate velocity differently. Device validity can change by exercise and speed. Use the same device, attachment point, metric and filtering method across a block. Do not mix mean and peak velocity or compare values from different brands as if they share an algorithm.
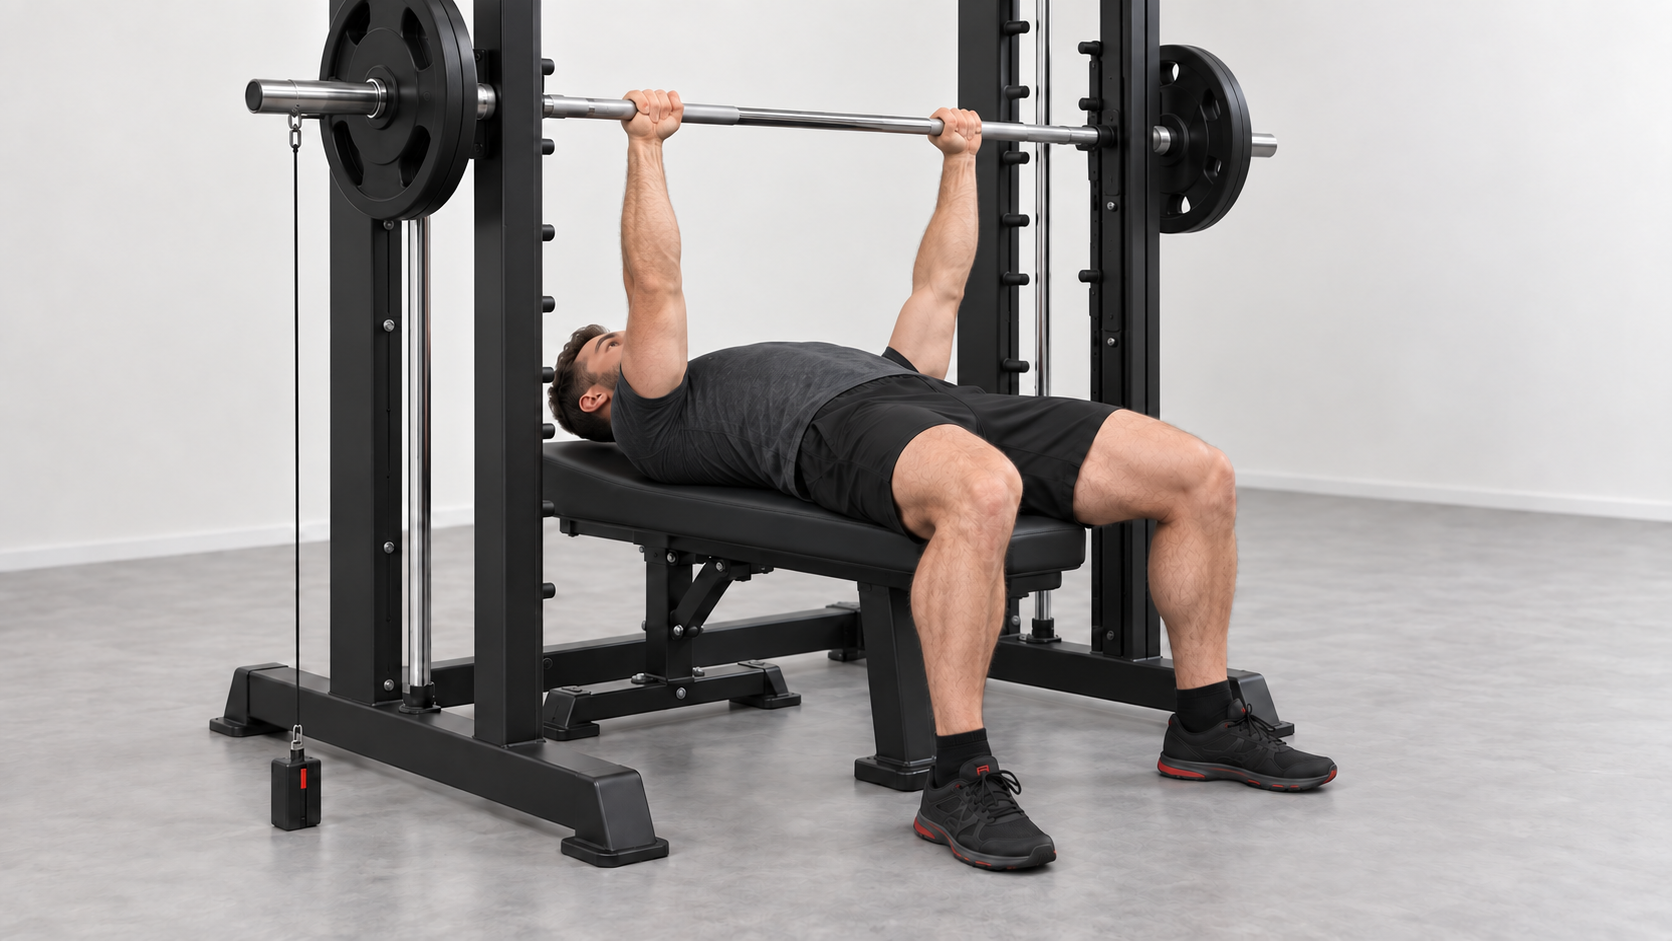
MEASUREMENT SETUP · CONCEPTUAL ILLUSTRATION
Make the movement repeatable before interpreting the number
- Warm up until technique and velocity are stable, not fatigued.
- Standardize grip, touch, pause, range, arch and command.
- Use maximal intended concentric velocity on every counted rep.
- Set a minimum absolute velocity or technical stop alongside percentage loss.
- Review outliers before changing the program; one loose cable or misgroove is not adaptation.
Programming by outcome
| Primary goal | Evidence-led starting band | What it buys | Main cost or caveat |
|---|---|---|---|
| Power / technical quality | 0–10% loss | High velocity and low rep fatigue | Very low volume; strength stimulus may need more sets |
| Efficient strength | 10–25% loss | Strong group-average 1RM response per repetition | Exact best threshold varies with intensity and athlete |
| Strength plus hypertrophy | 20–35% loss | Moderate volume and fatigue | Recovery demand rises; no universal cutoff |
| Hypertrophy / repetition endurance | 35–50% loss | More repetitions and, in bench trials, larger CSA or endurance changes | No consistent extra 1RM; substantial fatigue and time cost |
These are starting bands inferred from group evidence, not clinical or universal prescriptions. Choose relative intensity first. For a strength block, the 2026 data support placing much of the work at 70–85% 1RM and using a moderate loss threshold rather than trying to make light sets exhaustive. For hypertrophy, a higher threshold can be rational, but weekly set count, recovery and symptoms still constrain the dose.
Two conditions. One stopping decision.
Use the fastest valid repetition with the same setup, intent and metric.
Has the planned velocity loss been reached? Has the repetition left the technical standard?
Either condition ends the set. Record which one triggered the decision.
A speed reading cannot make an invalid repetition comparable to the reference.
Use a two-part stop rule: stop at the planned velocity loss or at the first invalid repetition, whichever comes first. If athletes repeatedly stop for technique before velocity, lower the load or improve the standard. If day-to-day first-rep velocity is unusually low, consider readiness and reduce load rather than forcing the planned number of repetitions.
What the Launch Pad Studies Show About Bar Velocity
In the acute Launch Pad crossover, 10 resistance-trained men performed five repetitions at 70% 1RM on a standard bench and the Launch Pad. Mean concentric velocity was 0.40 ± 0.09 versus 0.47 ± 0.09 m/s, and peak velocity was 0.57 ± 0.11 versus 0.66 ± 0.09 m/s; both differences were significant [13]. The experiment measured bar velocity across the tested condition. It did not calculate a threshold-based repetition-by-repetition velocity-loss metric.
MEASURED STUDY DATA · ACUTE CROSSOVER · n = 10
Higher bar velocity is a different measurement
Mean concentric velocity
m/s · condition mean · zero baselinePeak velocity
m/s · condition mean · zero baselineExact plotted values
| Metric | Flat (mean ± SD) | Launch Pad (mean ± SD) | Units |
|---|---|---|---|
| Mean velocity | 0.40 ± 0.09 | 0.47 ± 0.09 | m/s |
| Peak velocity | 0.57 ± 0.11 | 0.66 ± 0.09 | m/s |
The four-week trial used five sets to failure, three times weekly, with 150% eccentric resistance in both groups; the Launch Pad group gained more 1RM than the conventional-bench group [14]. The eight-week collegiate football trial used matched periodized programs and reported larger 1RM, NFL-225 and seated medicine-ball-throw improvements with the Launch Pad [15]. Those trials evaluated training outcomes rather than velocity loss as a mediator.
Together, the studies show higher measured bar velocity in the acute condition and larger strength or performance gains in two training comparisons. Joint Ops remains outside this published evidence chain. The scientific relevance is a clear, testable bridge from higher measured bar velocity to future repetition-by-repetition and mediator-focused studies.
Make the stopping rule visible
Record the fastest valid rep, the planned threshold, the technical standard and the actual reason each set ended. That turns velocity into a coaching tool rather than a dashboard ornament.
Evidence boundary: This article is educational and not medical advice. Velocity metrics do not diagnose fatigue, injury or readiness. Product studies apply only to their tested participants, protocols and outcomes and do not validate pain, injury-prevention or rehabilitation claims.
References
- Sánchez-Medina, L., & González-Badillo, J. J. (2011). Velocity loss as an indicator of neuromuscular fatigue during resistance training. Medicine & Science in Sports & Exercise, 43, 1725–1734. https://doi.org/10.1249/MSS.0b013e318213f880 ↩
- González-Badillo, J. J., Yáñez-García, J. M., Mora-Custodio, R., & Rodríguez-Rosell, D. (2017). Velocity loss as a variable for monitoring resistance exercise. International Journal of Sports Medicine, 38, 217–225. https://pubmed.ncbi.nlm.nih.gov/28192832/ ↩
- Rodríguez-Rosell, D., Yáñez-García, J. M., Sánchez-Medina, L., Mora-Custodio, R., & González-Badillo, J. J. (2020). Relationship between velocity loss and repetitions in reserve in the bench press and back squat exercises. Journal of Strength and Conditioning Research, 34, 2537–2547. https://doi.org/10.1519/JSC.0000000000002881 ↩
- Pareja-Blanco, F., Alcazar, J., Cornejo-Daza, P. J., Sánchez-Valdepeñas, J., Rodriguez-Lopez, C., Hidalgo-de Mora, J., et al. (2020). Effects of velocity loss in the bench press exercise on strength gains, neuromuscular adaptations and muscle hypertrophy. Scandinavian Journal of Medicine & Science in Sports, 30, 2154–2166. https://doi.org/10.1111/sms.13775 ↩
- Rodiles-Guerrero, L., Cornejo-Daza, P. J., Sánchez-Valdepeñas, J., Alcazar, J., Rodriguez-López, C., Sánchez-Moreno, M., et al. (2022). Specific adaptations to 0%, 15%, 25%, and 50% velocity-loss thresholds during bench press training. International Journal of Sports Physiology and Performance, 17, 1231–1241. https://doi.org/10.1123/ijspp.2021-0481 ↩
- Rodiles-Guerrero, L., Sánchez-Valdepeñas, J., Cornejo-Daza, P. J., Páez-Maldonado, J., Cano-Castillo, C., Bachero-Mena, B., et al. (2024). Effects of velocity loss during bench-press training with light relative loads. International Journal of Sports Physiology and Performance, 19, 1076–1086. https://doi.org/10.1123/ijspp.2023-0529 ↩
- Pareja-Blanco, F., Sánchez-Valdepeñas, J., Cornejo-Daza, P. J., & Rodiles-Guerrero, L. (2026). Optimizing strength and hypertrophy: the combined effect of intensity and velocity loss thresholds in bench press training. Medicine & Science in Sports & Exercise, 58(8), 1773–1781. https://doi.org/10.1249/MSS.0000000000003988 ↩
- Duffey, M. J., & Challis, J. H. (2007). Fatigue effects on bar kinematics during the bench press. Journal of Strength and Conditioning Research, 21(2), 556–560. https://doi.org/10.1519/R-19885.1 ↩
- Grgic, J., Schoenfeld, B. J., Orazem, J., & Sabol, F. (2022). Effects of resistance training performed to repetition failure or non-failure on muscular strength and hypertrophy: a systematic review and meta-analysis. Journal of Sport and Health Science, 11(2), 202–211. https://doi.org/10.1016/j.jshs.2021.01.007 ↩
- Rodiles-Guerrero, L., Cano-Castillo, C., Cornejo-Daza, P. J., Sánchez-Valdepeñas, J., Sañudo, B., Sánchez-Moreno, M., et al. (2026a). Effects of different velocity loss thresholds on strength, neuromuscular adaptations, and muscle hypertrophy during bench press training in women. Biology of Sport, 43, 187–198. https://doi.org/10.5114/biolsport.2026.152347 ↩
- Rodiles-Guerrero, L., Bachero-Mena, B., & Sánchez-Moreno, M. (2026b). Impact of prior fatigue on velocity loss as a set-termination criterion in the bench press exercise. Journal of Human Kinetics, 101, 35–48. https://doi.org/10.5114/jhk/214212 ↩
- Ocaña-García, Á., Herrero-Atiénzar, J. M., López-Gullón, J. M., Bonacasa, B., & Bayonas-Ruiz, A. (2026). A velocity-based approach to variable resistance training in the bench press: repetitions to failure and level of effort. Journal of Strength and Conditioning Research, 40(3), 272–282. https://doi.org/10.1519/JSC.0000000000005325 ↩
- Kidwell, J. A., Yamamoto, T., Hetherton, K. J., Truneh, N., Bright, J. J., Blatney, A. E., et al. (2026). Acute effects of thoracic-spinal elevation via a novel bench press pad on sEMG and barbell kinetics in resistance-trained males. International Journal of Exercise Science, 19(1), 1003. https://doi.org/10.70252/IJES2026103 ↩
- Goldman, P., Taylor, J., Yamamoto, T., Blatney, A. E., Sahni, T. K., Lechner, R. J., et al. (2025). Eccentrically overloaded bench press training: Augmenting strength gains via a novel bench press pad. Scientific Journal of Sport and Performance, 4(4), 480–490. https://doi.org/10.55860/JCDL3612 ↩
- Blatney, A. E., Kidwell, J. A., Yamamoto, T., Goldman, P., Hetherton, K. J., & Dolezal, B. A. (2026). Effects of an eight week training regimen with a novel bench press pad compared to a traditional bench on upper body strength and performance in collegiate American football players. Scientific Journal of Sport and Performance, 5(1), 10–21. https://doi.org/10.55860/RNUB8627 ↩
- González-Badillo, J. J., & Sánchez-Medina, L. (2010). Movement velocity as a measure of loading intensity in resistance training. International Journal of Sports Medicine, 31(5), 347–352. https://doi.org/10.1055/s-0030-1248333 ↩
- Sánchez-Medina, L., González-Badillo, J. J., Pérez, C. E., & Pallarés, J. G. (2014). Velocity- and power-load relationships of the bench pull vs. bench press exercises. International Journal of Sports Medicine, 35(3), 209–216. https://doi.org/10.1055/s-0033-1351252 ↩
- Cronin, J. B., McNair, P. J., & Marshall, R. N. (2003). Force-velocity analysis of strength-training techniques and load: implications for training strategy and research. Journal of Strength and Conditioning Research, 17(1), 148–155. https://doi.org/10.1519/00124278-200302000-00023 ↩